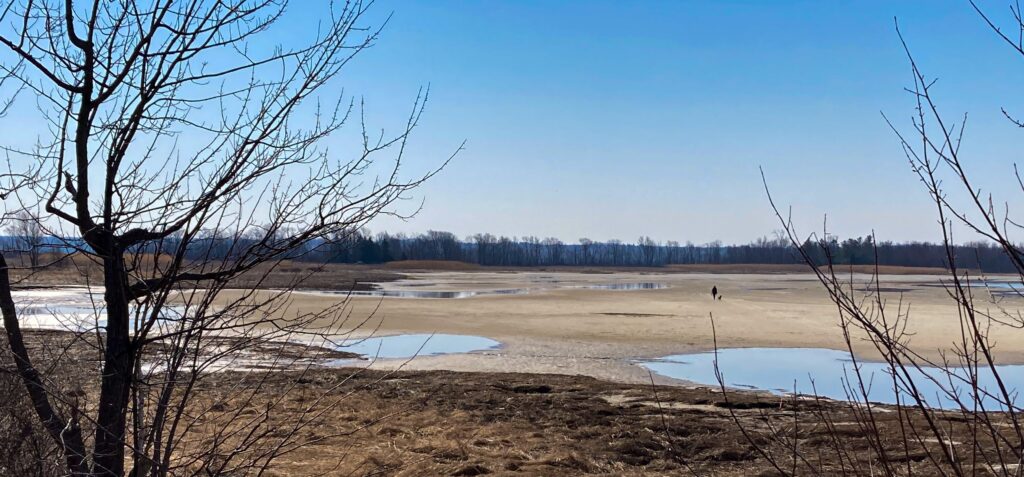
One could be forgiven for thinking Lake Nipissing’s early April shoreline looked like low tide at the ocean. Some of the lake bottom had been exposed long enough for the wind to blow the dried sand into small dunes. Numerous near-shore islands were no longer islands. At the end of Cranberry Trail, the lake levels were low enough to easily bike to the point of land before Grand Trunk Island where the Centre Channel goes into Callander Bay. Normally, that trip requires wading through water that reaches ankle to knee height. In North Bay, one could walk from Sunset Point to Park’s Creek along the fourth sandbar from shore. And the walleye (aka pickerel) spawning area at Sunset Park was high and dry.
Visually, it seemed the water levels were lower than normal. Despite this, an article in the Nugget said water levels were about average for this time of year, which is borne out in this graph. (https://wateroffice.ec.gc.ca/)
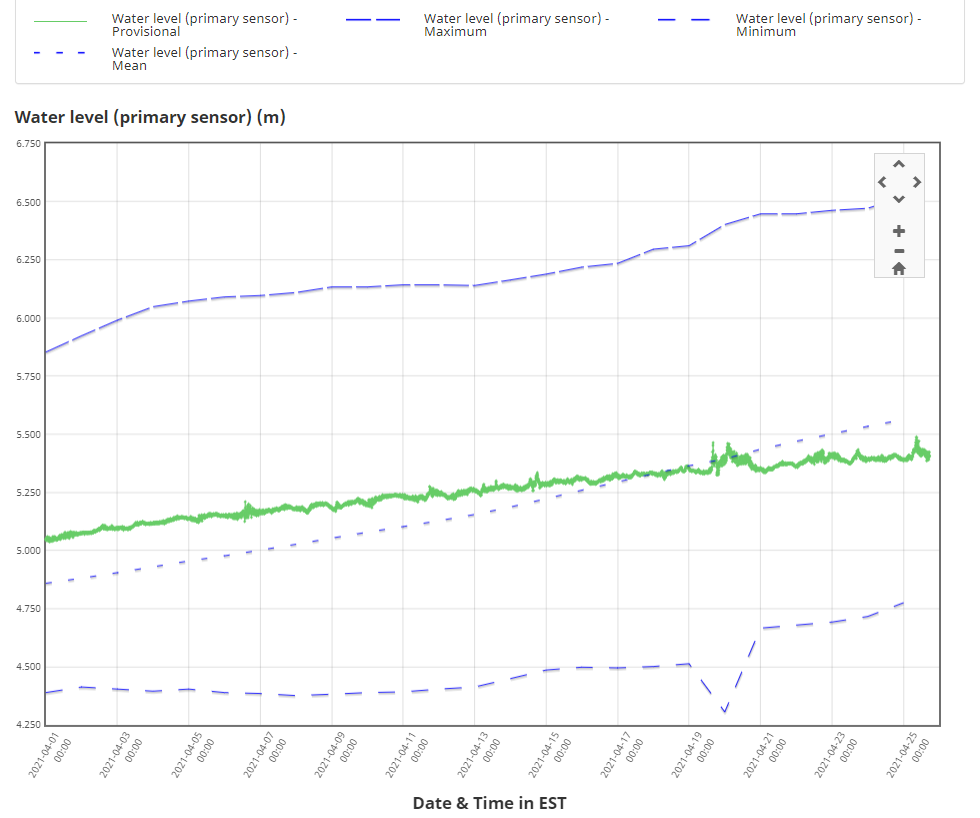
Real-Time Hydrometric Data Graph for LAKE NIPISSING AT NORTH BAY (02DD006) [ON]
The graph shows real-time measurements (green line) from one station, an average water level (short-dashed line), and maximum and minimum water levels (long-dashed lines). Presumably, the y-axis (the numbers running up the left side of the graph from 4.250 to 6.750) are short forms for the actual lake height (i.e., 4.6 m = 194.6 m). According to this graph, early April’s water levels were actually above average lake level, not lower as the hectares of bare sand around Cranberry Trail attested.
It’s hard to reconcile this year’s low water levels with the fact that the graph says these water levels are higher than average. The site doesn’t say how “average” is calculated or defined though. What is the range of the average (e.g., ± 0.20 cm, or ± 100 cm?)? Which, and how many, years were used to develop this average? Is there a standardized baseline of years they used? For example, in climatology a standardized 30-year average (1951-1980, or 1981-2010) is used for comparison to current temperatures. It is unclear whether this standardization approach was used with Lake Nipissing water level averages. It is possible the entire dataset (1933-2020) is used to calculate the average water level; this could skew the average as historical water release guidelines may have aimed for a different lake level than the past 30 years of lake levels.
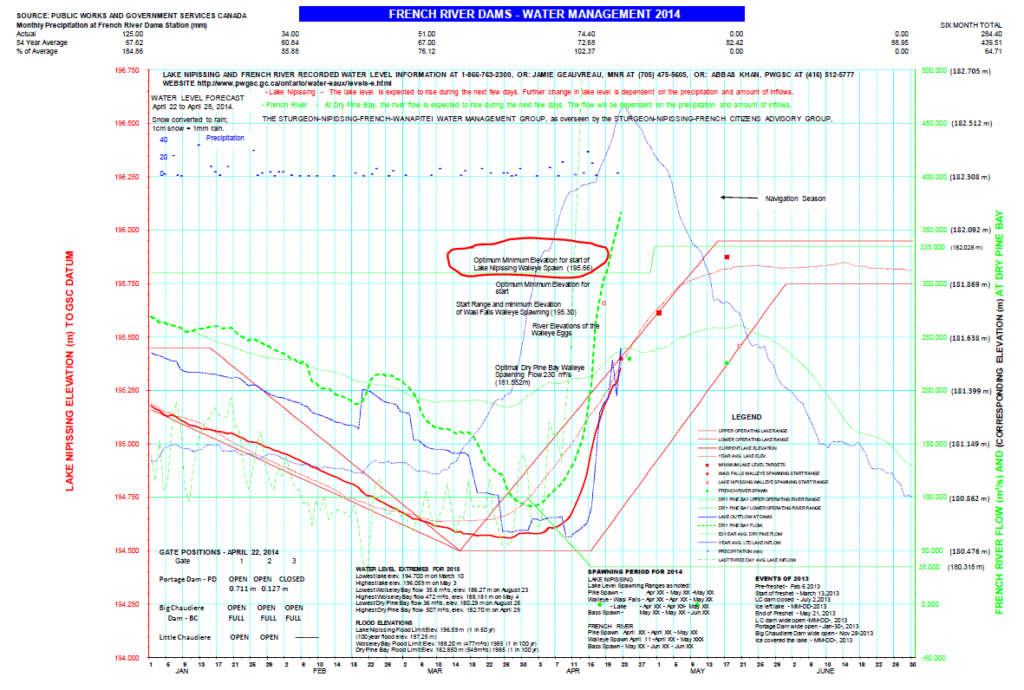
There is a clue that perhaps the current average is on the low end. A 2014 Lake Nipissing State of the Basin Report (LNSBR) has this graph.
https://lnsbr.nipissingu.ca/wp-content/uploads/sites/10/2013/11/lakeniplevels2013.pdf
Ignore the fact that if this graph were submitted as a class assignment, the professor would send it back to be redone as several graphs, and with colours that wouldn’t frustrate a person with colour-blindness. The clue on this graph deals with the lake level for walleye spawning, specifically, optimum minimum elevation for start of walleye spawning. That optimal minimum elevation is 195.66 m.
In 2020, walleye spawned the last week of April when water levels were 195.55 m, which is fairly close to optimal minimum spawning level. Their Sunset Park spawning rocks were under water and observers saw the fish right at the edges of the shore.
This year, the walleye spawned during the 2nd week of April when the water levels were about 195.15 m (195.1—195.2), according to the NBMCA graph below.
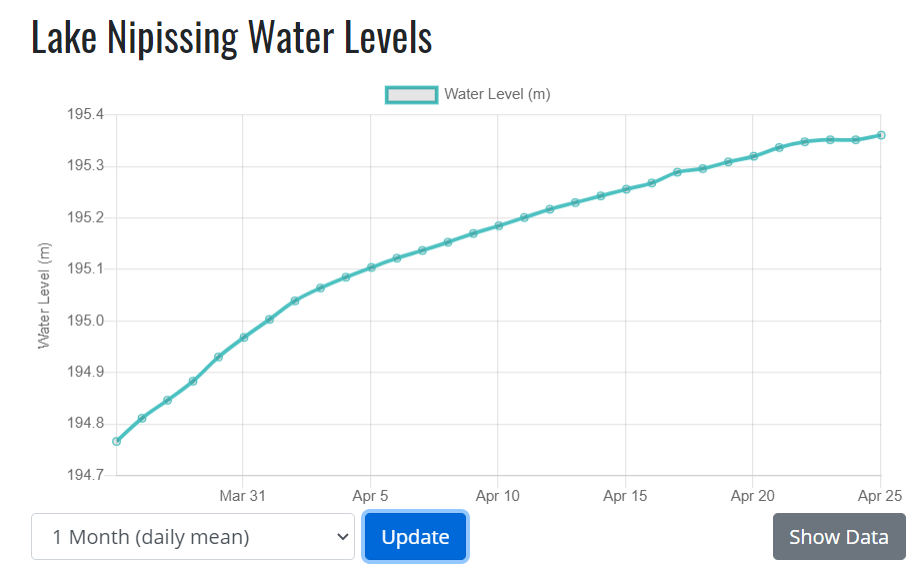
https://www.nbmca.ca/watershed-management/flood-forecasting/spring-2021-freshet/
At 195.15 m, the Sunset Park spawning rocks were well above water. The fish had to spawn in deeper water further out, unlike the previous year when they could spawn right next to shore.
Now, according to the first graph, the “average” water level is 194.8 m. At that level, not only would the regular walleye spawning rocks be out of the water, but so would the deeper water rocks they used this year. This also means the optimal minimum elevation for the start of spawning (195.66) is quite a bit higher than the average water level (194.8), which indicates the optimum minimum level isn’t usually reached.
And at an average lake level of 194.8 m, most of the Sunset Park spawning area would be above water, and walleye would not be spawning there. Yet, that area where they spawn is consistently under water.
The NBMCA and MNR have said publicly there is no issue, see BayToday story HERE.
This seems to indicate that the “average” water level has been skewed to the low end. It is so low it doesn’t reach the published optimum minimal level for spawning, much less the optimum higher levels; the average is so low it wouldn’t cover the Sunset Park spawning grounds even in the deeper water.
The average could be low for many reasons. Maybe because it includes early years when water levels weren’t more carefully regulated. Or, maybe the plus/minus range needs to be narrowed, or at least quantified. Or maybe combining the measurements from all stations rather than just the one shown in the graph will show a closer alignment with the average.
Whatever the reason, it’s hard to look at all the bare sand and the dry spawning grounds and conclude that this year’s water levels are above average rather than considerably below average.